Last updated: October 7, 2026
How we replaced a logistics company's manual billing and reporting with an automated data platform
The data wasn't the problem. Billing rules, reports and audits ran by hand on top of scattered sources that no one fully trusted.
- Industry
- Logistics & shipping, US
- Platform
- PostgreSQL
- Engagement
- Roughly 18–20 months
- Our role
- Data engineering and analytics
Billing calculations, which were applied by hand to every order before
Flagging of data issues, which used to surface through manual audits days later
Records processed every day by the pipeline that replaced hand-built reports
Summary
A fast-growing logistics company in the US was running most of its day-to-day numbers by hand. Billing, reporting and monitoring were all manual, with no single version of the data anyone fully trusted. We rebuilt the company's data operations, replacing manual effort with automated pipelines, validated data and self-service dashboards.
About the Client
A logistics and shipping company operating across several US cities, with a high volume of orders moving through its systems every day. Operations, billing and management all depended on the same underlying data, yet no data engineering function existed.
| Detail | Specifics |
|---|---|
| Industry and size | Logistics and shipping, mid-sized, high-volume operation across several US cities |
| Data volume | 2M+ records a day through the pipeline |
| Platform | PostgreSQL, Python, SQL, Apache Airflow, Apache Superset, REST APIs |
| Team | No dedicated data engineering function before the engagement; operations, billing and management all relied on the same data |
| State before engagement | Billing, reporting and monitoring done by hand; no single version of the data anyone fully trusted |
The Situation
A fast-growing logistics company was running most of its day-to-day numbers by hand. Billing, reporting and monitoring were all manual, and as order volume climbed the manual process stopped keeping up.
Reports were built when someone asked for them. Management and operations waited on those requests, and the numbers they received came from several sources that did not agree with each other.
Data problems were found by manual audit, usually well after they had affected billing or reports.
Challenges
Billing rules applied by hand, order by order
Billing depended on several variable business rules that had to be applied manually for every order. The process broke down as volume grew.
Reporting that was reactive, on data nobody fully trusted
Numbers were assembled on request rather than available when needed, drawn from multiple sources with no single trusted version.
Problems found late, no way to self-serve
Data issues were caught through manual audits, often well after the fact. Non-technical teams had no way to get answers on their own.
Diagnosis
We started with the people closest to the problem and spoke to the teams doing the manual work before building anything. We also looked at what data already existed before introducing new tools. Four causes came out of that.
Billing logic lived in people, not in code
Several variable business rules decided what each order cost, and they were applied by hand. Encoding them was the prerequisite for any automation.
No governed layer between sources and reports
Data lived across multiple sources with no single version anyone fully trusted. It needed raw, cleaned and business-ready stages before reports could rely on it.
Quality checks depended on manual audits
Nothing validated data as it moved, so errors surfaced after reports had already gone out.
No self-service access to data
Operations, billing and management all had to ask technical staff for every answer. Self-service was impossible without access control that did not exist yet.
What We Did
Matched ingestion frequency to how the data is used
The starting point was ingestion: deciding, for each kind of data, how often it actually needed to move. Activity that needed watching for unusual patterns is pulled in frequently, close to real time. The core volume of shipment and billing data runs on a steady daily cycle, since that matches how the business uses it.
Apache Airflow orchestrates this scheduling, so each part of the pipeline runs on the cadence it needs and nothing runs more often than that.
Built a staged pipeline with access control from the start
Data moves through a structured pipeline with clear stages: a raw layer where data lands exactly as it came in, a cleaning and validation layer where it is checked and corrected, and a final layer where it is ready for the business to use. This fixes the missing governed layer between sources and reports.
Access control was built into the pipeline from the start, not added later, so the right people and systems see the right data at each stage, from source through to destination.
We also modeled the data into structured, reusable datasets designed around how the business asks questions, not around however the source systems happened to store things.
Automated billing, reporting and monitoring on top of it
We automated the billing process by encoding the business rules that used to be applied by hand, so calculations became consistent and fast.
Operations and management got real-time visibility through Apache Superset dashboards, with access control so the right people see the right data. An automated monitoring layer watches activity data and flags unusual patterns far closer to real time than manual audits could.
We also connected live data into the client's own customer-facing systems through API integration.
Started on plain-language queries for non-technical teams
Later, we began exploring a generative AI layer on top of all of this. It gives non-technical stakeholders a way to ask questions about their data in plain language, instead of needing to read a dashboard themselves. This work is exploratory.
Architecture: Before and After
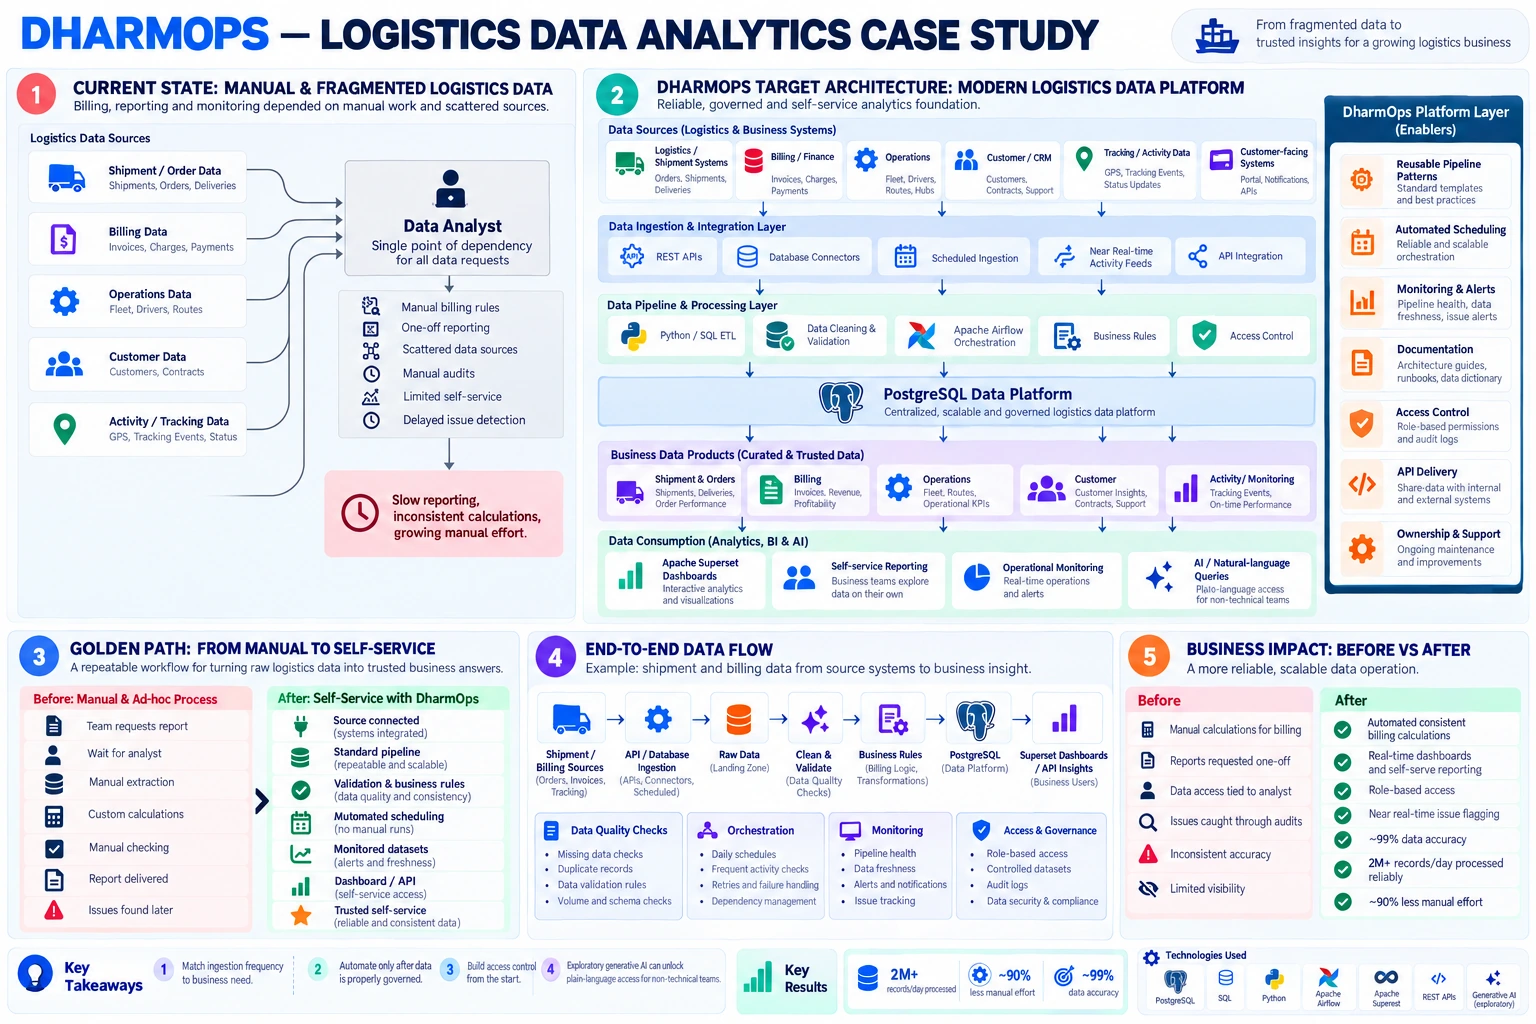
Before and After
| Step | Before | After |
|---|---|---|
| Billing calculation | Manual, slow and error-prone | Automated, consistent calculations |
| Reporting | One-off requests, built on demand | Real-time dashboards, self-serve |
| Getting answers | Limited to whoever was technical | Role-based self-service, plus plain-language AI queries |
| Finding bad data | Manual audits, after the fact | Flagged close to real time |
| Data accuracy | Inconsistent across sources | Held through ongoing validation |
Results
| Metric | Before | After | Change |
|---|---|---|---|
| Manual effort, billing and reporting | All manual | Automated | Consistent and fast |
| Data accuracy | Inconsistent across sources | Validated on an ongoing basis | One trusted version |
| Issue detection | Days later, by manual audit | Close to real time | Days to near real time |
| Data processed | Handled by hand | 2M+ records a day | Reliable daily pipeline |
| Report availability | Built by hand, on request | Live dashboards | Used by operations and management |
What changed for the client
- The pipeline processes over 2 million records a day, reliably.
- Manual effort across reporting and billing dropped sharply.
- Data accuracy is maintained through ongoing validation.
- Issues in the underlying data are caught close to real time instead of days later.
- Dashboards are used across both operations and management. They are not sitting unopened.
Key Takeaways
Match ingestion frequency to what the business needs
Defaulting to real time everywhere is not required. Matching frequency to need keeps a pipeline fast where it matters and simple where it does not.
Govern the data before automating on top of it
Automating a high-friction manual process only pays off once the underlying data is governed, not just scripted to work for now.
Build access control in from the start
Self-service dashboards only hold up when proper access control sits behind them, built in from the start rather than bolted on later.
A small first step into generative AI helps early
Even a small, exploratory step into generative AI can make a difference for non-technical teams, long before any serious AI infrastructure investment.
Technology Stack
| Layer | Tool |
|---|---|
| Database | PostgreSQL |
| Extraction and transformation | Python, SQL, REST APIs |
| Orchestration | Apache Airflow |
| Dashboards | Apache Superset |
| Plain-language queries (exploratory) | Generative AI, language-model querying |
Still building billing and reports by hand?
On a diagnostic call we walk through where your data comes from and which manual steps cost the most time.
Start with a Diagnostic Call