Data Reliability for Banking & Insurance
Regulatory reports need traceable inputs. We add lineage and freshness checks so you can show where every number came from and catch a stale source before the submission.
Pipelines that run successfully still produce stale, incomplete, or silently wrong data. We build the observability, lineage, and automated recovery layer that catches it before your business users do.
We work hands-on with: Airflow, Grafana, Prometheus, Datadog, PagerDuty, Kubernetes, PostgreSQL, dbt, Power BI, Tableau, Looker, Metabase.
Data reliability engineering is the discipline of keeping critical data pipelines and the datasets they produce continuously correct, available, and recoverable, not just monitored for uptime.
It's broader than the old backup/HA/DR framing for a single database: data observability and data lineage trace root cause across an entire pipeline, from source to the dashboard or model consuming it.
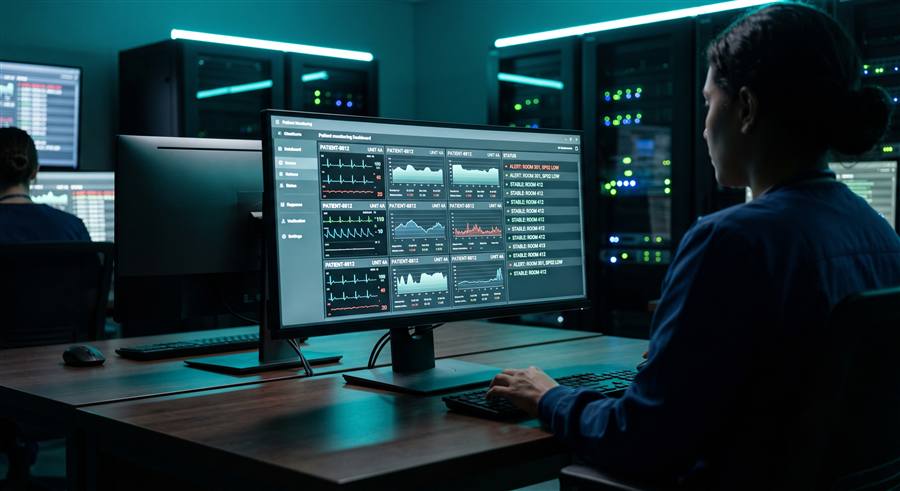
A job that exits successfully can still write stale, incomplete, or silently wrong data. Job-level monitoring won't catch that. We monitor the data itself: freshness, schema, volume, and quality, so a break surfaces as an alert to your team instead of a complaint from a business user.
When something does break, lineage-based root cause analysis traces the bad number back through the pipeline to the upstream job, table, or schema change that caused it, and known failure patterns recover automatically instead of waiting on a human to notice and rerun a job by hand.
Reliability also covers what the data means once it's clean: a tested semantic and metrics layer gives every number, revenue, churn, active users, one checked definition instead of five slightly different versions across dashboards, and we build or fix up the Power BI, Tableau, Looker, or Metabase report on top of it, so the report itself is reliable, not just the pipeline feeding it.
A schema change silently broke three downstream dashboards, and finance flagged the wrong total before anyone on the data team saw an alert.
A pipeline exits with code 0 but writes stale, duplicate, or incomplete rows. Job-level monitoring has nothing to say about it.
A known, recurring failure pattern still has no automated replay or backfill, so it costs a human a 2am investigation every time it recurs.
Finding the upstream job, table, or schema change behind a bad metric means manually greping logs and Slack threads instead of following lineage.
A quick lookup across the four problems above.
| Situation | Likely Solution |
|---|---|
| A bad number reached people before your team caught it | Data Reliability — freshness, volume, schema, and quality monitoring on the tables that matter |
| Jobs succeed, but the data they write is stale, duplicate, or incomplete | Data Reliability — schema-change and quality checks catch a breaking change before it reaches a dashboard |
| The same failure pages someone every few weeks with no automated fix | Pipeline Reliability — automated retry, backfill, and recovery for known failure patterns |
| Root cause takes an afternoon of grepping logs and Slack threads, not minutes | Data Observability — lineage-based root cause analysis traces a bad number back to the exact upstream change |
| "Revenue" is calculated three different ways across three dashboards | Semantic & Metrics Layer — one tested definition, used everywhere |
Scoped to the datasets where a break actually costs you something.
Freshness, schema, volume, and quality checks on the tables and pipelines that actually matter, so the first person to notice a break is you, not the exec whose dashboard went stale.
Lineage-based root cause analysis traces a broken metric back through the pipeline to the upstream change that caused it, instead of a manual grep through logs and Slack threads.
Known failure patterns get automated replay, backfill, and rerun. Your team gets paged for the failures that actually need a decision, not the ones with an established fix.
Six capability areas that keep pipelines, the datasets they produce, and the reports built on top correct, not just monitored for uptime.
Pipeline monitoring, failure detection, retry and rerun, automated recovery, backfill, incident management, and pipeline SLOs, so a known failure pattern recovers on its own instead of paging someone every time it recurs.
Freshness, completeness, volume, distribution, schema-change, and data quality checks, plus anomaly detection, tuned to your actual SLAs instead of noisy defaults that get muted within a week.
Data and pipeline observability, column-level lineage, and root-cause analysis, with alerting that points at the likely upstream cause before a human starts investigating.
Recovery plans, failover, and RPO/RTO targets for the data platform itself, verified with regularly scheduled recovery drills instead of a live incident being the first real test.
Cleaning and modeling raw tables into a dbt-tested semantic layer with one checked definition per number, so revenue, churn, or active users means the same thing in every report.
Building or fixing up the Power BI, Tableau, Looker, or Metabase report on top of the tested data, so the dashboard itself is reliable from the source up, not just the pipeline feeding it.
We map your critical pipelines and tables, identify where freshness, schema, or quality issues currently go undetected, and score your incident response process against how it actually gets used.
We define reliability SLOs for your highest-priority datasets and design the observability coverage, alert thresholds, and lineage depth needed to hit them.
We implement the observability, alerting, and lineage layer on your existing stack, and build automated recovery for your known, recurring failure patterns.
We document runbooks for the failure modes we've found and train your team to run and extend the system without us in the room.
On retainer, we tune alert thresholds as your pipelines evolve, extend coverage to new datasets, and stay on call for incidents that fall outside the known playbook.
Built on the orchestration, warehouse, and monitoring stack you already run: Airflow, PostgreSQL and other warehouses, Grafana, Prometheus, Datadog, PagerDuty, and Kubernetes-hosted pipelines, dbt for the semantic/metrics layer, feeding Power BI, Tableau, Looker, or Metabase.
| Area | Before | After |
|---|---|---|
| Failure detection | A business user reports the stale dashboard first | Freshness and schema-change alerts fire before anyone downstream notices |
| Root cause | Manual grep through logs and Slack threads | Lineage traces the bad number to the exact upstream job or schema change |
| Recovery | Someone reruns the job by hand, if they remember how | Known failure patterns replay, backfill, or rerun automatically |
| Regional failover (healthcare HA engagement) | Manual multi-hour regional cutover | <30s automatic failover, 99.99% uptime SLA across 3 regions |
| Reporting under load (traffic management engagement) | Peak-hour reporting timeouts | 12x faster reports, 99.9% uptime maintained |
| DharmOps | Reactive On-Call Only | In-House Hire | Platform Alone | |
|---|---|---|---|---|
| Time to catch a silent break | Tuned to your actual SLAs | After a business user complains | Depends on one person's coverage | Depends on who's watching the tool |
| Root cause time | Minutes, via lineage | Manual investigation | Manual, until they build lineage themselves | Dashboard exists, still needs a human to interpret it |
| Cost model | Scoped assessment + retainer, no license | "Free" until an incident costs you | Full salary + benefits, months to hire and ramp | Annual license, plus a team to own it |
| Coverage | A team, not one person's vacation-limited time | None | Single point of failure | None, it's a tool, not a team |
Pipelines that run successfully can still deliver stale or wrong data. The cost depends on what reads it: a regulator, a claims team, or a pricing engine.
Regulatory reports need traceable inputs. We add lineage and freshness checks so you can show where every number came from and catch a stale source before the submission.
Claims, provider directory, and quality-reporting data drive payments and compliance filings. We monitor volume, schema, and completeness on these feeds and route alerts to the team that owns each one.
A price or inventory feed that silently stops leaves the storefront showing the wrong thing. We add freshness monitors on those feeds and automated recovery for the common failures.
When billing and usage dashboards disagree, nobody trusts either. We define each metric once in a tested semantic layer and monitor it against the source system.
Reconciliation breaks between the ledger and the warehouse are found late. We run continuous checks on totals and record counts so a break surfaces the same day.
Meter and sensor feeds have gaps and late arrivals. We detect missing intervals and anomalies, and backfill them before billing and forecasting run.
Tell us which pipelines and dashboards matter most, and we'll show you where a schema change or quality regression could reach them today without tripping an alert.
See how other engagements played out in our case studies.
We assess where your pipelines can fail silently and build the observability and recovery layer that catches it first.