By Yash Amin, Founder and CEO · Published · Updated
How we cut a city traffic system's sensor ingestion latency by 85%
The hardware wasn't the limit. One 800M-row sensor table with no partitioning and no time-series indexes was forcing sequential scans on every write and read.
- Industry
- Public infrastructure, US city traffic management
- Platform
- PostgreSQL 14, SQL Server 2019
- Engagement
- Performance tuning and query optimization
- Our role
- Database performance engineering
lower sensor ingestion latency
Was several seconds per write
faster operational reports
Was timing out at peak hours
platform uptime held
All changes applied without downtime
About the Client
A US city traffic management authority that runs traffic loops, cameras and incident detectors across the city. Operations staff depend on that sensor data to detect incidents and coordinate signals, so ingestion delays and failed reports show up directly on the road.
| Detail | Specifics |
|---|---|
| Industry and size | Traffic management authority for a US city, with sensor coverage expanding city-wide |
| Data volume | One sensor event table of about 800M rows on PostgreSQL |
| Platform | PostgreSQL 14 for real-time sensor ingestion, SQL Server 2019 for operational reporting and signal coordination |
| Team | Traffic operations staff relied on both databases daily; no dedicated database performance owner |
| State before engagement | Ingestion latency of several seconds, sensor events queuing up, and peak-hour reports timing out |
The Situation
The platform ran on two databases: PostgreSQL for real-time sensor ingestion, and SQL Server for operational reporting and traffic signal coordination dashboards. Both degraded as sensor coverage expanded city-wide.
PostgreSQL ingestion latency had grown from milliseconds to several seconds. Sensor data queued up and traffic event detection lagged.
SQL Server reports timed out during the morning and evening commute windows, the exact times when operations staff needed responsive data most.
Challenges
Sensor data queuing up during the commute
PostgreSQL ingestion latency had grown from milliseconds to several seconds. Events backed up and detection of traffic incidents lagged behind the road.
Reports timing out at peak hours
SQL Server reports used by traffic operations staff failed during the morning and evening commute windows, when responsive data mattered most.
Two databases degrading together
Ingestion, reporting and the ETL between them each had separate bottlenecks, so fixing one side alone would not have restored the system.
Diagnosis
We profiled ingestion and report workloads on both databases before changing anything. Five causes came out of that.
One 800M-row table with no partitioning
The PostgreSQL sensor event table was a single table, so queries fell back to sequential scans. It also had no time-series indexes on the event timestamps that every real-time query filters on.
Autovacuum not tuned for a write-heavy load
Default autovacuum settings could not keep up with constant sensor writes, which left severe table bloat behind.
Connection pool exhausted at peak ingestion
During peak periods the PostgreSQL connection pool ran out, and writes were rejected.
Outdated plans and nested loops on SQL Server
Statistics had not been updated since the initial deployment. Reporting queries ran nested loop joins across unindexed intersection tables, and concurrent reports contended on TempDB.
Full-export ETL between the two databases
The PostgreSQL to SQL Server transfer re-exported everything on each run instead of moving only what had changed.
What We Did
Partitioned and indexed the sensor ingestion table
We moved the sensor event table to monthly range partitioning, with data older than 90 days archived to cold partitions. Queries now touch only the partitions they need instead of scanning 800M rows.
BRIN indexes on the timestamp columns and composite B-tree indexes on sensor ID plus timestamp serve the real-time lookups.
Tuned PostgreSQL for sustained writes
Autovacuum was tuned for the write-heavy workload (scale factor 0.01, reduced cost delays) so bloat stops building up. PgBouncer in transaction mode now absorbs peak ingestion concurrency, which removed the write rejections.
Rebuilt the SQL Server reporting path
We rewrote the reporting queries with hash join hints and added covering indexes on the intersection and signal tables. Full-scan statistics updates and index rebuilds replaced the plans that had gone stale at deployment.
TempDB data files were added to match the CPU core count, which removed allocation contention under concurrent reports.
Replaced full ETL exports with change capture
Change Data Capture on SQL Server and logical replication slots on PostgreSQL now move only incremental changes. pg_stat_statements and SQL Server Query Store were set up so query regressions are visible before operations staff notice them.
Architecture: Before and After
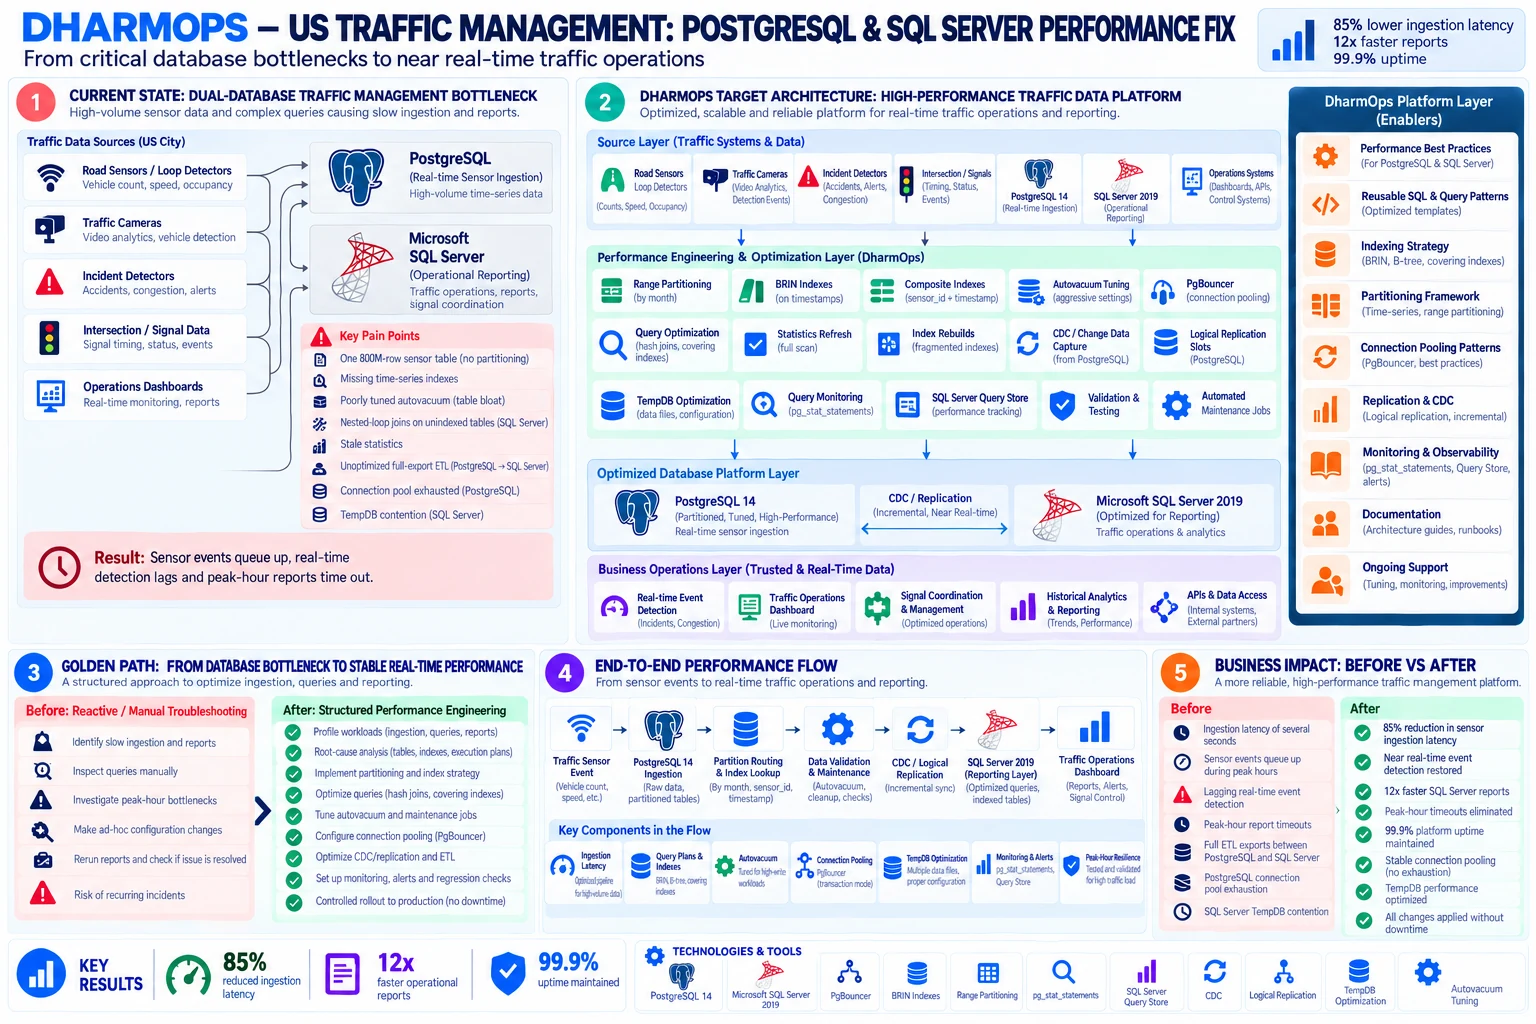
Swipe the diagram sideways to read it.
View diagram full sizeBefore
Sensor feeds wrote into one unpartitioned 800M-row PostgreSQL table, while SQL Server reports ran on stale statistics and full-export ETL. Sensor events queued up and peak-hour reports timed out.
After
Sensor events land in monthly partitions behind PgBouncer, and change capture feeds an indexed SQL Server reporting layer. Monitoring on both sides flags regressions early.
Before and After
| Step | Before | After |
|---|---|---|
| Sensor ingestion | Writes took several seconds and queued up | Partitioned, indexed and pooled; near real-time detection restored |
| Peak-hour reports | Timed out during commute windows | 12x faster, with timeouts eliminated |
| PostgreSQL to SQL Server sync | Full ETL exports | Incremental change capture and logical replication |
| Table maintenance | Default autovacuum, growing bloat | Tuned autovacuum and automated maintenance jobs |
| Query health | No ongoing visibility | pg_stat_statements and Query Store with alerts |
| Rolling out changes | Reactive, ad-hoc configuration changes | Staged and regression-checked, with no downtime |
Results
Swipe the table sideways to see the Change column.
| Metric | Before | After | Change |
|---|---|---|---|
| Sensor ingestion latency | Several seconds | 85% lower | Near real-time restored |
| SQL Server report speed | Timing out at peak | 12x faster | Timeouts eliminated |
| Platform uptime | At risk during tuning | 99.9% maintained | No downtime for changes |
| Event detection | Lagging behind sensors | Near real time | Queue backlog gone |
| PostgreSQL connections | Pool exhausted at peak | Stable pooling | No write rejections |
| SQL Server TempDB | Contention under load | Optimized | Concurrent reports stable |
Technology Stack
| Layer | Tool |
|---|---|
| Databases | PostgreSQL 14, Microsoft SQL Server 2019 |
| Indexing and partitioning | Range partitioning, BRIN indexes, composite B-tree indexes |
| Connection handling | PgBouncer (transaction mode) |
| Data movement | Change Data Capture, PostgreSQL logical replication |
| Tuning | Autovacuum tuning, TempDB optimization, statistics refresh |
| Monitoring | pg_stat_statements, SQL Server Query Store |
Database Performance Questions
Why does sensor data ingestion slow down on a large PostgreSQL table?
In this case, one 800M-row sensor event table had no partitioning and no time-series indexes, so queries fell back to sequential scans. Default autovacuum settings could not keep up with constant writes, which left severe bloat, and the connection pool ran out at peak ingestion so writes were rejected. Ingestion latency had grown from milliseconds to several seconds.
How do you cut ingestion latency on a table with hundreds of millions of rows?
We moved the table to monthly range partitioning with data older than 90 days archived to cold partitions, added BRIN indexes on the timestamp columns and composite B-tree indexes on sensor ID plus timestamp, tuned autovacuum (scale factor 0.01), and put PgBouncer in transaction mode in front of the database. Sensor ingestion latency dropped 85%.
Why do SQL Server reports time out at peak hours?
Here, statistics had not been updated since the initial deployment, so reporting queries ran nested loop joins across unindexed intersection tables, and concurrent reports contended on TempDB. We rewrote the queries with hash join hints, added covering indexes, refreshed statistics and rebuilt indexes, and added TempDB data files to match the CPU core count. Reports became 12x faster.
How do you move data between PostgreSQL and SQL Server without full exports?
Use change capture on both sides. Change Data Capture on SQL Server and logical replication slots on PostgreSQL move only incremental changes, replacing an ETL job that re-exported everything on every run.
Can database performance work be done on a live traffic system without downtime?
Yes. Changes were staged and checked for query regressions, and the platform held 99.9% uptime throughout. pg_stat_statements and SQL Server Query Store were set up so regressions are visible before operations staff notice them.
What are the limitations of PgBouncer transaction mode?
In transaction mode, PgBouncer returns a server connection to the pool after each transaction, which lets a small pool serve many more clients. That is how it absorbed peak sensor ingestion here and stopped writes being rejected. The tradeoff is that session-level state, such as session settings and session advisory locks, cannot be relied on across transactions, so the application must not depend on it.
What causes SQL Server TempDB contention, and how do you fix it?
Concurrent reports contended on TempDB allocation in this system. We added TempDB data files to match the CPU core count, which removed the allocation contention. Concurrent reports stayed stable at peak hours.
Sensor data queuing up, or reports timing out at peak?
On a diagnostic call we walk through your ingestion path and slowest reports to find where the time goes.
Start with a Discovery Call