By Yash Amin, Founder and CEO · Published · Updated
How we fixed low GPU utilization at a US retailer and made model retraining 3x faster
The GPUs weren't too slow. They were waiting on data: every epoch reread the same files from storage, and every worker repeated the same CPU work.
- Industry
- Retail and e-commerce, US
- Platform
- PyTorch on Kubernetes, NVIDIA A100, Amazon S3
- Engagement
- Data pipeline fixes and ongoing support
- Our role
- AI data infrastructure
GPU activity during training
was 20–30%
Faster weekly retrain
18–22 hours down to 5–7
Nightly recommendation retrain
was 6–8 hours
Lower GPU spend per retrain
same GPUs, fewer GPU hours
About the Client
A US omnichannel retailer that sells online and through physical stores. Its demand forecasting model sets stock levels for each store, and its recommendation model decides what shoppers see on the website and app.
Both models retrain on a schedule over growing event and product data, so how long a retrain takes decides how fresh the forecasts and recommendations are each morning.
| Detail | Specifics |
|---|---|
| Industry and size | US omnichannel retailer selling online and through physical stores |
| Data volume | 25–40 TB of clickstream events, order history and product images in Amazon S3, growing every week |
| Platform | PyTorch training on a Kubernetes GPU cluster with 8–16 NVIDIA A100 GPUs; Parquet event data and millions of small JPEG product images |
| Team | An ML team of 4–6 owned the models and a platform team owned the cluster; nobody owned the path from storage to the GPU |
| State before engagement | GPU activity at 20–30%, weekly demand retrain at 18–22 hours, nightly recommendation retrain at 6–8 hours |
The Situation
The weekly demand forecasting retrain took 18–22 hours, and the nightly recommendation retrain took 6–8 hours. On busy nights the recommendation job was still running when stores opened, so shoppers saw the previous day's results.
The cluster dashboard showed every GPU in use, so the team read the slow retrains as a capacity problem. The plan was to add GPUs before the holiday season.
Before approving that spend, the retailer wanted to know whether more GPUs would actually make training faster, or whether something else was holding the existing ones back.
Challenges
Retrains ran into store hours
The nightly recommendation retrain took 6–8 hours, so on busy nights stores and the website opened on the previous day's recommendations.
The dashboard said the GPUs were busy
Every GPU showed as allocated, so the cluster looked full. Nobody could see how much of that time the GPUs spent waiting for the next batch.
More GPUs were the planned fix
The next step on the roadmap was a larger cluster. That would have raised the bill without touching the cause.
Diagnosis
We measured GPU activity against time spent waiting on data across both retrain jobs. GPU activity averaged 20–30%, and 60–70% of every training step went to waiting for the next batch. A cached-data test, training on batches already held in memory, raised GPU activity above 85%. That confirmed the input pipeline as the cause. Four problems sat behind it.
The same files were reread every epoch
Each epoch pulled the full training set from S3 again, including millions of small JPEG objects. Each small read paid its own request latency.
Every worker repeated the same CPU work
Each DataLoader worker decoded and resized the same images and rebuilt the same feature joins on every epoch. The CPUs ran at 100% while the GPUs waited.
Nothing was prefetched
Two workers per GPU, no prefetching and no pinned memory meant the next batch was only built after the GPU asked for it.
Monitoring measured allocation, not work
The dashboard showed which GPUs were assigned to a job. It didn't show GPU activity against time spent waiting on data, so the problem looked like a shortage of GPUs.
This pattern shows up well beyond retail. Uber reported GPU utilization of 10–15% on a deep learning workload until it fixed its input pipeline. At NVIDIA GTC in March 2026, Adobe's CTO said about two-thirds of GPU time in early training runs went to waiting for data.
What We Did
Preprocessed once per data version
A separate job now decodes and resizes images and computes features once for each data version. Training reads the finished output, so CPUs stop repeating work the run already did.
Packed small files into shards
Millions of small objects became tar shards of 100–500 MB, streamed from S3 in sequence. Fewer, larger reads replaced millions of small ones.
Cached shards on each GPU node
The first epoch streams shards from S3 and writes them to local NVMe disk. Later epochs read from local disk instead of the network.
Tuned the DataLoader and measured GPU work
Workers were matched to vCPUs, with prefetch_factor, pin_memory and persistent_workers set, and random crops and flips moved to the GPU. DCGM metrics in Prometheus and Grafana now show GPU activity against data wait for each job, with an alert when a job starts waiting again.
Architecture: Before and After
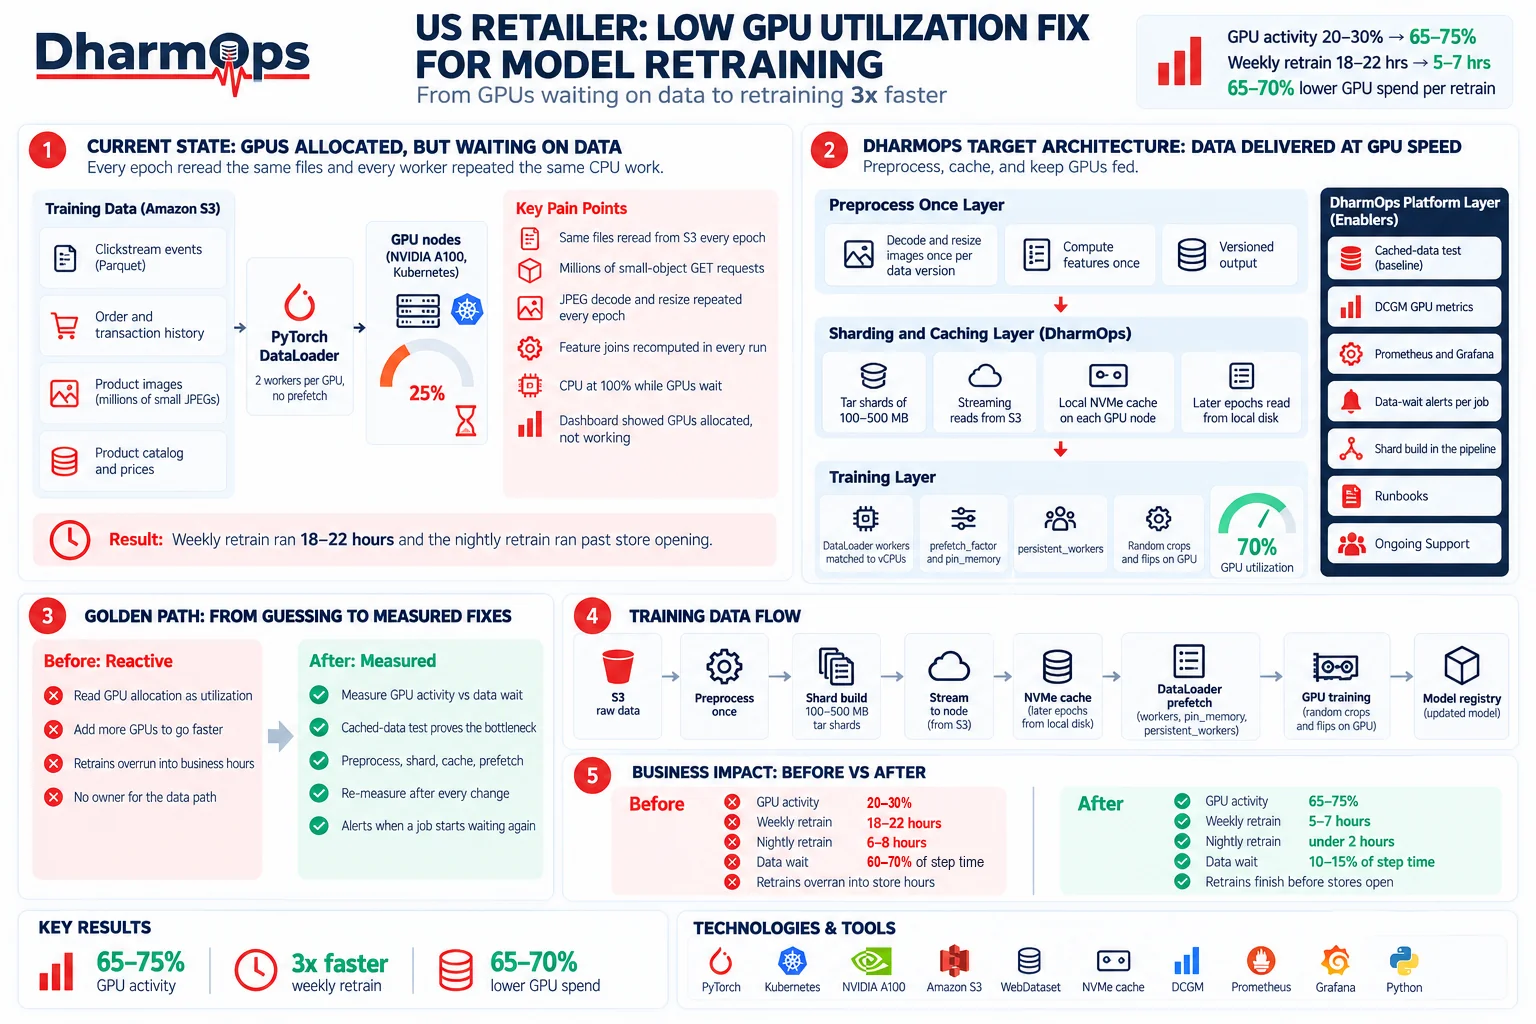
Swipe the diagram sideways to read it.
View diagram full sizeBefore
Every epoch pulled raw files from S3 through two DataLoader workers per GPU. Each worker decoded, resized and joined the same data again, and the GPUs waited for each batch.
After
Data is preprocessed once per version, packed into shards and cached on each GPU node. A tuned DataLoader prefetches batches, and monitoring shows GPU activity against data wait for every job.
Implementation Process
Diagnostic and baseline
Measured GPU activity, data wait and CPU load on both retrain jobs, and ran the cached-data test to confirm the bottleneck.
Preprocessing and sharding in staging
Built the preprocess-once job and the shard build, and checked that model accuracy matched the old pipeline.
Caching and DataLoader tuning
Added the local NVMe cache, tuned the DataLoader and re-measured each change against the baseline.
Production rollout
Moved the nightly retrain first, then the weekly retrain, each with a rollback to the old data path.
Handover, then ongoing support
Delivered runbooks, dashboards and alerts, walked the ML and platform teams through them, and moved to monthly reviews of GPU activity and cost per workload.
Before and After
| Step | Before | After |
|---|---|---|
| Reading training data | Full dataset pulled from S3 every epoch | Streamed once, then read from local NVMe |
| Image decode and resize | Repeated by every worker, every epoch | Done once per data version |
| Feature joins | Rebuilt inside every training run | Computed once and stored |
| Batch loading | Built only when the GPU asked | Prefetched while the GPU works |
| Monitoring | GPUs shown as allocated | GPU activity against data wait, per job |
| Finding a slowdown | Noticed when a retrain overran | Alert when a job starts waiting on data |
Results
| Metric | Before | After | Change |
|---|---|---|---|
| GPU activity during training | 20–30% | 65–75% | About 2.5x |
| Data wait, share of step time | 60–70% | 10–15% | Mostly removed |
| Weekly demand retrain | 18–22 hours | 5–7 hours | 3x faster |
| Nightly recommendation retrain | 6–8 hours | Under 2 hours | Done before stores open |
| GPU spend per retrain | Baseline | 65–70% lower | Same cluster |
| S3 requests per training run | Millions of small reads | 85–95% fewer | Lower request cost |
The planned GPU expansion was dropped. The GPU hours freed up now go to two to three extra model experiments a week on the same cluster.
Tradeoffs and What We'd Do Differently
Random augmentation stays on the fly
Preprocessing once only works for steps that give the same result every time. Random crops and flips have to change each epoch, so we moved them to the GPU instead of storing them.
Shards add a build step
Each new data version needs a shard build before training, which adds time to the data pipeline. We scheduled it right after the data lands so it is ready before the retrain starts.
The cache helps from the second epoch
The first epoch still streams from S3. Jobs that train for only one or two epochs gain less from the cache than from the sharding and preprocessing.
We didn't add a high-performance file system
A shared parallel file system would have removed the first-epoch stream too, at a higher monthly cost. We would revisit it if the dataset outgrows the local disks.
Technology Stack
| Layer | Tool |
|---|---|
| Training | PyTorch, Python |
| Compute | Kubernetes, NVIDIA A100 GPUs |
| Storage | Amazon S3, local NVMe cache on each GPU node |
| Data loading | WebDataset-style tar shards, PyTorch DataLoader with prefetching |
| Preprocessing | Batch preprocess-once job per data version |
| Monitoring | NVIDIA DCGM, Prometheus, Grafana, data-wait alerts per job |
Low GPU Utilization Questions
Why is my GPU utilization so low during training?
Most often the GPU is waiting on data, not short of compute. In this retailer's case, every epoch reread the same files from S3 and every DataLoader worker repeated the same image decoding and feature work, so GPU activity sat at 20–30%. Fixing data delivery raised it to 65–75% on the same GPUs.
How do you know the data loader is the bottleneck?
Run a cached-data test. Train for a short time on batches already held in memory and compare GPU activity with a normal run. If activity jumps when data arrives instantly, the input pipeline is the cause. Here it rose from 20–30% to over 85% in the test, which confirmed the bottleneck before any change was made.
Why does a GPU dashboard show busy when training is slow?
Many dashboards show a GPU as allocated to a job, not whether it is doing work. A GPU can be assigned for the whole run and still spend most of each step waiting for the next batch. Metrics such as NVIDIA DCGM activity, shown against data wait per job, separate the two.
What does DataLoader num_workers do, and how should you set it?
num_workers sets how many CPU processes prepare batches in parallel for PyTorch. Too few and the GPU waits; too many and workers compete for CPU and memory. Start near the number of vCPUs per GPU, then measure. Here, two workers per GPU was far too low, but raising it alone didn't fix the problem, because each worker still repeated the same decoding every epoch.
How do caching, sharding and prefetching reduce GPU idle time?
Sharding packs millions of small files into large files that stream efficiently. Caching keeps those shards on local disk, so later epochs skip the network. Prefetching builds the next batches while the GPU works on the current one. Together they cut data wait in this case from 60–70% of each training step to 10–15%.
How much can fixing the data pipeline save on GPU cost?
It depends on how much time the GPUs spend waiting. Here, GPU spend per retrain fell 65–70% because the same jobs finished in about a third of the GPU hours. Published cases show a similar pattern: Uber reported GPU utilization rising from 10–15% to over 60% and compute costs falling by nearly 80% after fixing its input pipeline.
Do you need more GPUs or a faster file system to fix low GPU utilization?
Not usually first. This retailer planned to add GPUs, which would have raised the bill while every GPU still waited on data. Preprocessing once, sharding, local caching and prefetching fixed it on the existing cluster. A parallel file system is worth considering only when the dataset outgrows local disks.
GPUs allocated, but training still slow?
Start with a 30-minute discovery call. If it's a fit, the diagnostic measures GPU activity against time spent waiting on data and shows which fix removes the most wait.
Start with a Discovery Call